This is the last part of my four-part homelab series. So far, I’ve talked about why I built my homelab, how I handle networking, and how I run software and virtualization. In this post, I’ll close things out by talking about monitoring and observability — the stuff that helps me see what’s actually happening in my setup.
Why I Needed More Than Proxmox’s Graphs
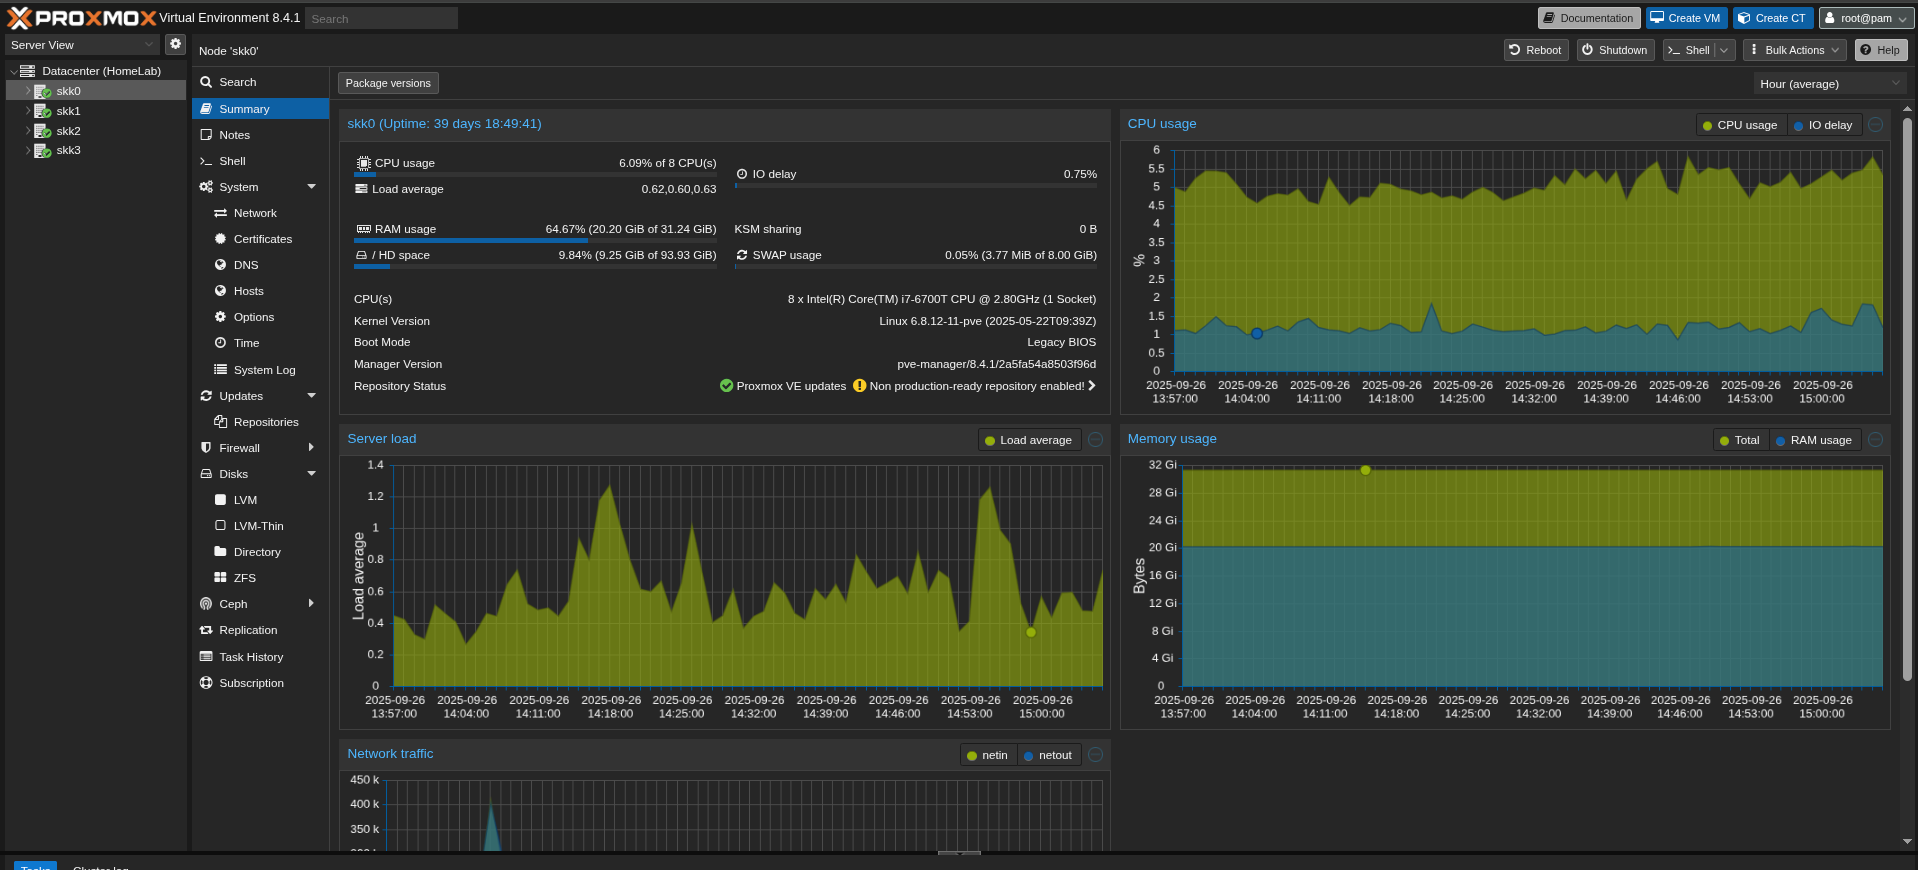
Proxmox has a neat web interface, and by default, it shows CPU, RAM, disk I/O, and network graphs for each VM or container. That was nice at first. But they were limited:
- The graphs are very generic — just total CPU, memory, disk, etc.
- Memory reporting is misleading since it counts buffers/cache as “used.”
- No built-in alerts (at least before Proxmox VE 8.1).
One of the situations that pushed me toward better monitoring was with my FireflyIII instance. It runs inside my homelab, but I was routing external access through a WireGuard tunnel connected to a DigitalOcean droplet. At one point, the droplet started having intermittent connectivity issues to my homelab. The result? FireflyIII would randomly become unreachable. Since a couple of friends also use my instance, I only found out when they asked me what was going on.
From Proxmox’s perspective, everything looked fine — CPU was low, memory was stable, disk I/O was minimal, and the service itself was still running. Nothing in those graphs told me that FireflyIII was effectively down.
Looking back, if I’d had proper monitoring and notifications in place, I would have been alerted the moment the connection to the droplet dropped. Instead, I was playing catch-up. It was a clear reminder that even a homelab setup benefits from observability — especially when other people rely on it.
My Monitoring Journey
Like most of my homelab experiments, I didn’t land on the “right” tool immediately. I tried a bunch of them.
Elastic Stack
Elastic Stack is the famous combination of Elasticsearch, Logstash, and Kibana. It’s powerful, enterprise-grade stuff — but also heavy. My small cluster doesn’t need a full enterprise log pipeline, and I didn’t want to waste precious resources running it.
Netdata
Netdata has a beautiful dashboard and auto-detection for almost everything. I didn’t like how much it pushed me toward their cloud service at the time. I prefer my metrics local, not tied to an external platform. I’ve since found out that you can fully host it locally without any dependency on the cloud, so it might be worth experimenting with again in the future.
Prometheus + Grafana
This duo is probably the gold standard for homelabs. It’s flexible, customizable, and battle-tested. But I realized I didn’t need that level of detail or complexity just yet. It felt like I’d spend more time maintaining it than using it.
Discovering Beszel
I was browsing r/selfhosted when I came across Beszel — a lightweight monitoring tool made specifically for homelabs. And it was exactly what I wanted.
Here’s why it clicked:
- Simple setup: install the server (I used Docker), deploy agents, done.
- No database hassle: it uses SQLite, so there’s no need to run or maintain a separate database.
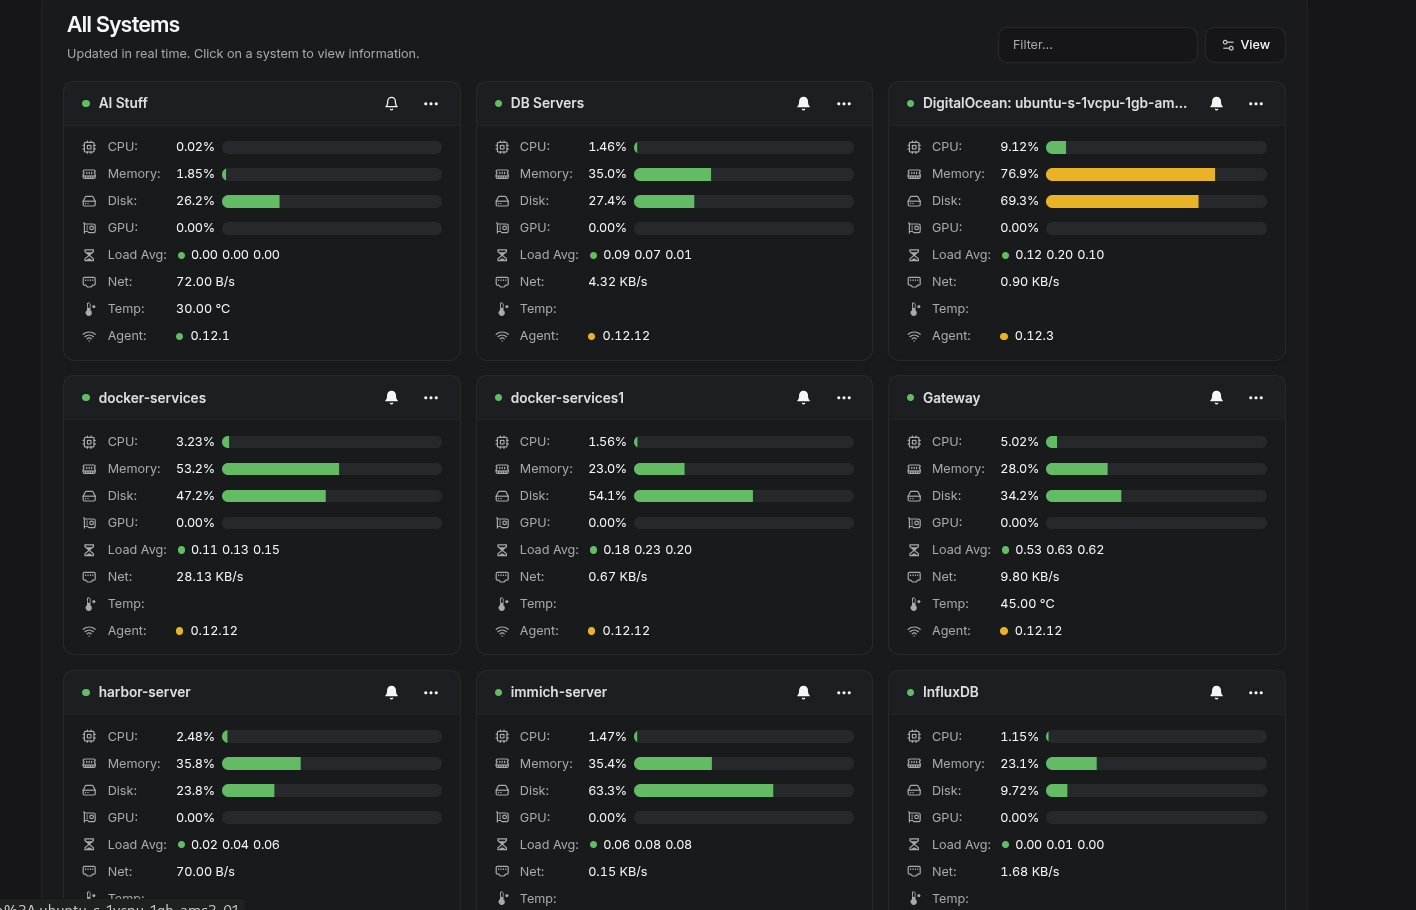
- Built-in web UI: no need for Grafana dashboards.
- Focus on essentials: CPU, RAM, disk, and network metrics across VMs and Docker containers.
- Lightweight: Its CPU and Memory footprint is low:
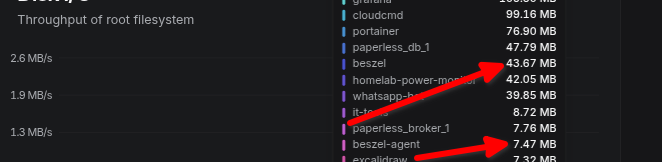
It’s opinionated and minimal, which I actually like. It doesn’t try to be everything — just the basics, done cleanly.
Running Beszel is as simple as running the Docker command:
docker run -d \
  --name beszel-server \
  -p 8090:8090 \
  -v /opt/beszel/data:/data \
  henrygd/beszel
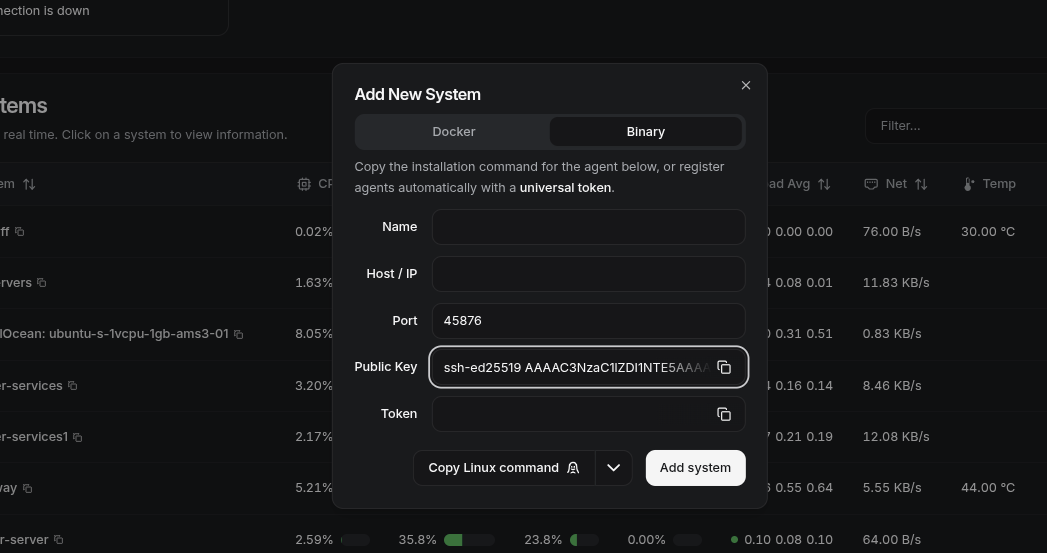
Then deploy agents by copying and running the commands from the "Add System" prompt:
Adding Uptime Kuma for Services
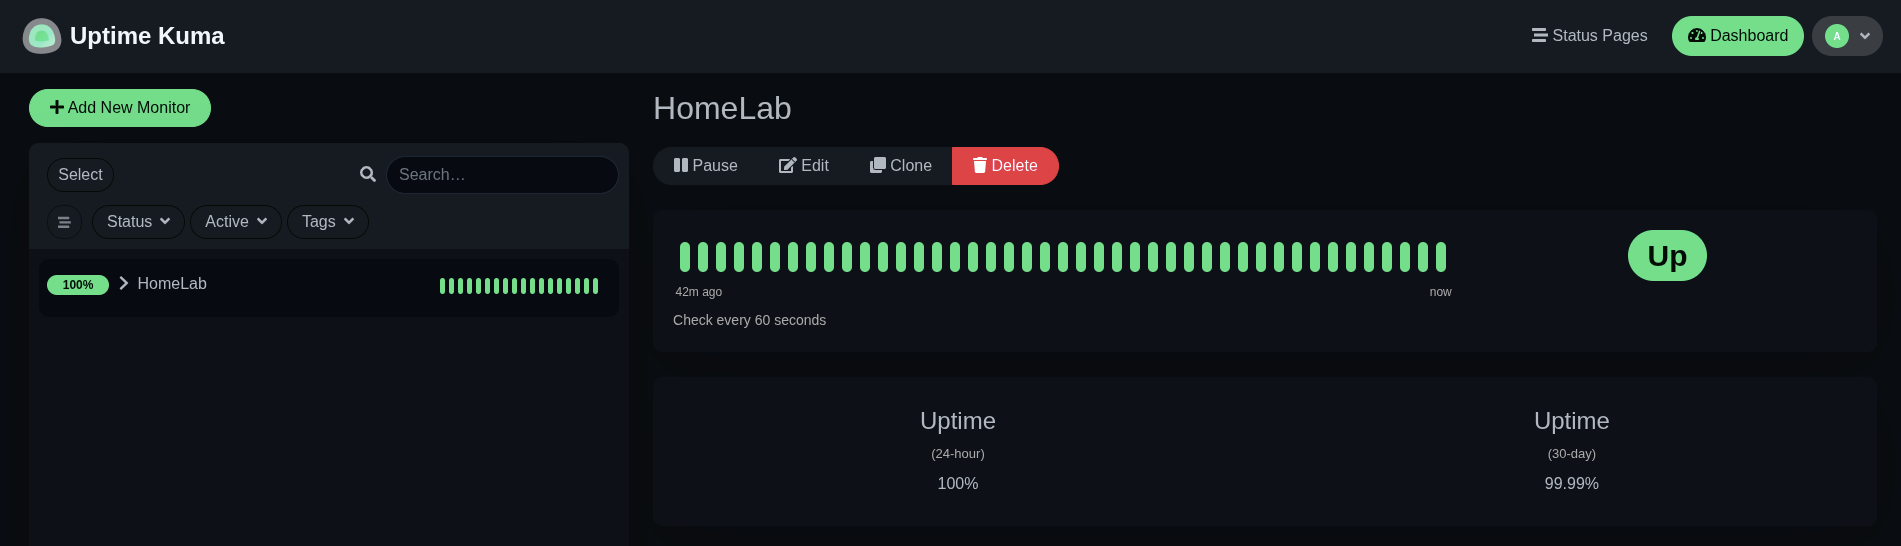
While Beszel is great for host-level stats, I also wanted to track whether my apps were actually up or down. That’s where Uptime Kuma fits in.
Uptime Kuma is a self-hosted status monitor — like a personal Pingdom. It lets me keep tabs on whether my homelab services are reachable and it can send notifications if something fails.
It is very flexible in that:
- You can monitor via simple pings, HTTP(s) requests, TCP ports, or even DNS queries.
- It comes with a clean web UI, no Grafana dashboards or external services needed.
- It supports multiple notification channels (I use Gotify, so I get mobile push alerts).
Setting It Up
Like Beszel, I run Uptime Kuma in Docker. Setup was straightforward:
docker run -d \
  --name uptime-kuma \
  -p 3001:3001 \
  -v /opt/uptime-kuma:/app/data \
  louislam/uptime-kuma
Monitoring Network Traffic with SNMP
System metrics are one thing, but I also wanted visibility into my network traffic — especially how much data my homelab was pushing through the WAN. Since my router is a MikroTik, the simplest way to get that data was via SNMP (Simple Network Management Protocol).
MikroTik has a simple web interface I used to enable SNMP, but you can also enable it via the command interface:
/ip snmp set enabled=yes
/ip snmp community add name=public addresses=192.168.10.0/24
Then confirm by polling the counters:
snmpwalk -v2c -c public 192.168.10.1
Using Telegraf to Poll SNMP
I used Telegraf (part of the InfluxData stack) to parse the OIDs. It has a built-in inputs.snmp plugin that polls the router and forwards the data to InfluxDB.
Here is an example config for Telegraf:
# Configuration for telegraf agent
[agent]
  interval = "10s"
  round_interval = true
  metric_batch_size = 1000
  metric_buffer_limit = 10000
  collection_jitter = "0s"
  flush_interval = "10s"
  flush_jitter = "0s"
  precision = ""

  hostname = ""
  omit_hostname = false
[[outputs.influxdb_v2]]
  urls = ["http://192.168.10.29:8086"] # ← InfluxDB IP

  token = "$INFLUX_TOKEN"
  organization = "homelab"
  bucket = "network-traffic"

[[inputs.snmp]]
  agents = [ "udp://192.168.10.1:161" ]       # ← MikroTik IP
  version = 2
  community = "public"
  timeout = "5s"
  retries = 3
  name = "mikrotik_interface"

  ## Global Tags for easier filtering
  [inputs.snmp.tags]
    device = "mikrotik-router"

  ## Interface Table (bandwidth and interface names)
  [[inputs.snmp.table]]
    name = "interface"
    oid = "IF-MIB::ifTable"

    [[inputs.snmp.table.field]]
      name = "ifDescr"
      oid = "IF-MIB::ifDescr"
      is_tag = true

    [[inputs.snmp.table.field]]
      name = "ifAlias"
      oid = "IF-MIB::ifAlias"
      is_tag = true

    [[inputs.snmp.table.field]]
      name = "ifType"
      oid = "IF-MIB::ifType"

    [[inputs.snmp.table.field]]
      name = "ifSpeed"
      oid = "IF-MIB::ifSpeed"

    [[inputs.snmp.table.field]]
      name = "ifInOctets"
      oid = "IF-MIB::ifInOctets"

    [[inputs.snmp.table.field]]
      name = "ifOutOctets"
      oid = "IF-MIB::ifOutOctets"

    [[inputs.snmp.table.field]]
      name = "ifInErrors"
      oid = "IF-MIB::ifInErrors"

    [[inputs.snmp.table.field]]
      name = "ifOutErrors"
      oid = "IF-MIB::ifOutErrors"
This tells Telegraf to pull in the bytes in/out counters for each interface, tagging them with ifDescr (like ether1, ether2, etc.). The results are then sent to InfluxDB.
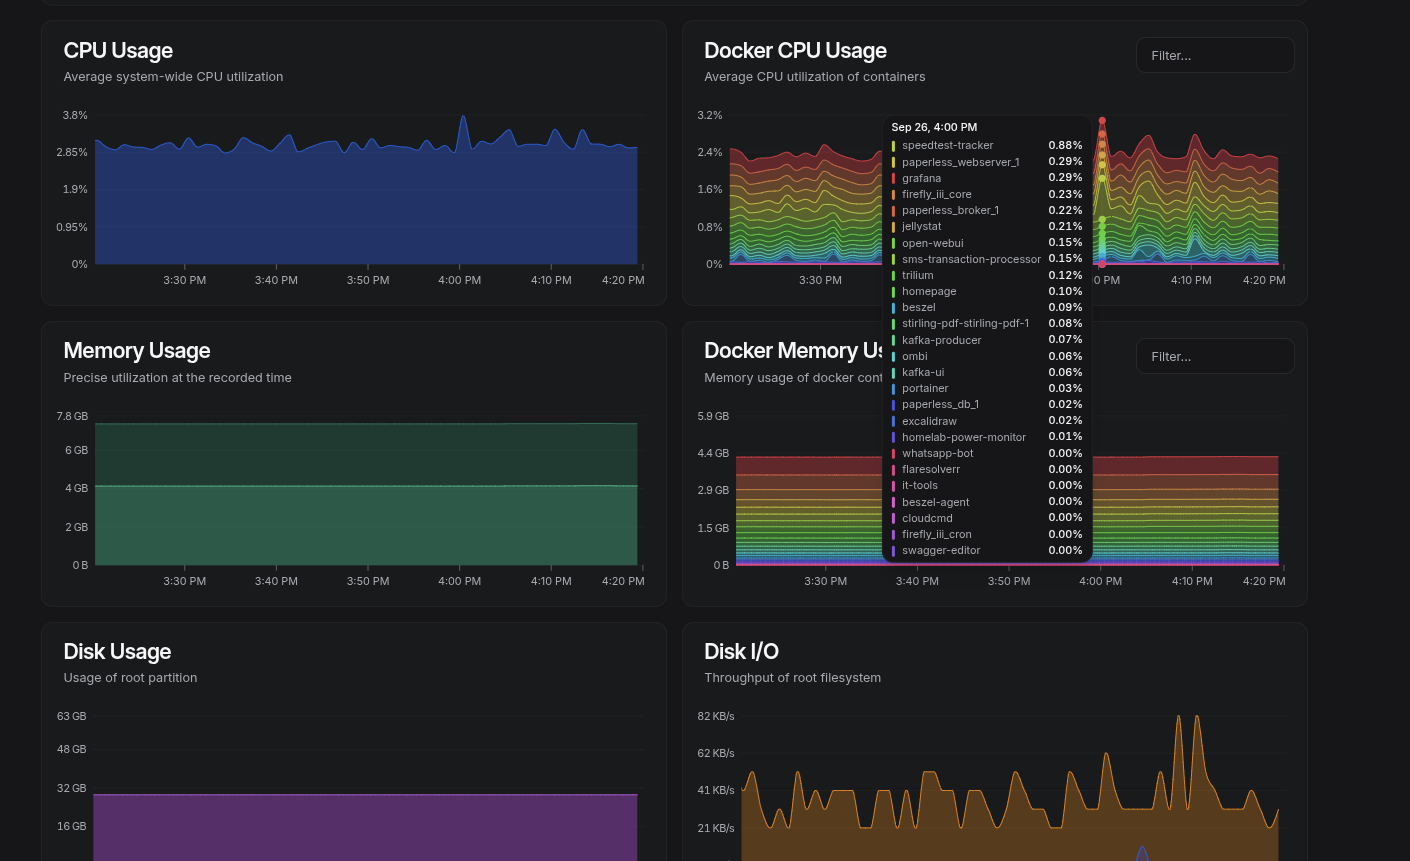
Visualizing in Grafana
InfluxDB stores the raw counters, so in Grafana, I used the Flux query language to calculate rates. For example, WAN traffic on ether1:
from(bucket: "network-traffic")
  |> range(start: v.timeRangeStart, stop: v.timeRangeStop)
  |> filter(fn: (r) => r._measurement == "interface")
  |> filter(fn: (r) => r.ifDescr == "ether1")
  |> filter(fn: (r) => r._field == "ifInOctets" or r._field == "ifOutOctets")
  |> derivative(unit: 1s, nonNegative: true) // Calculate the rate of change in bytes per second
  |> map(fn: (r) => ({
    r with
    _value: if r._field == "ifOutOctets" then -1.0 * r._value * 8.0 else r._value * 8.0
  }))
  |> aggregateWindow(every: v.windowPeriod, fn: mean, createEmpty: false)
  |> yield(name: "bandwidth")
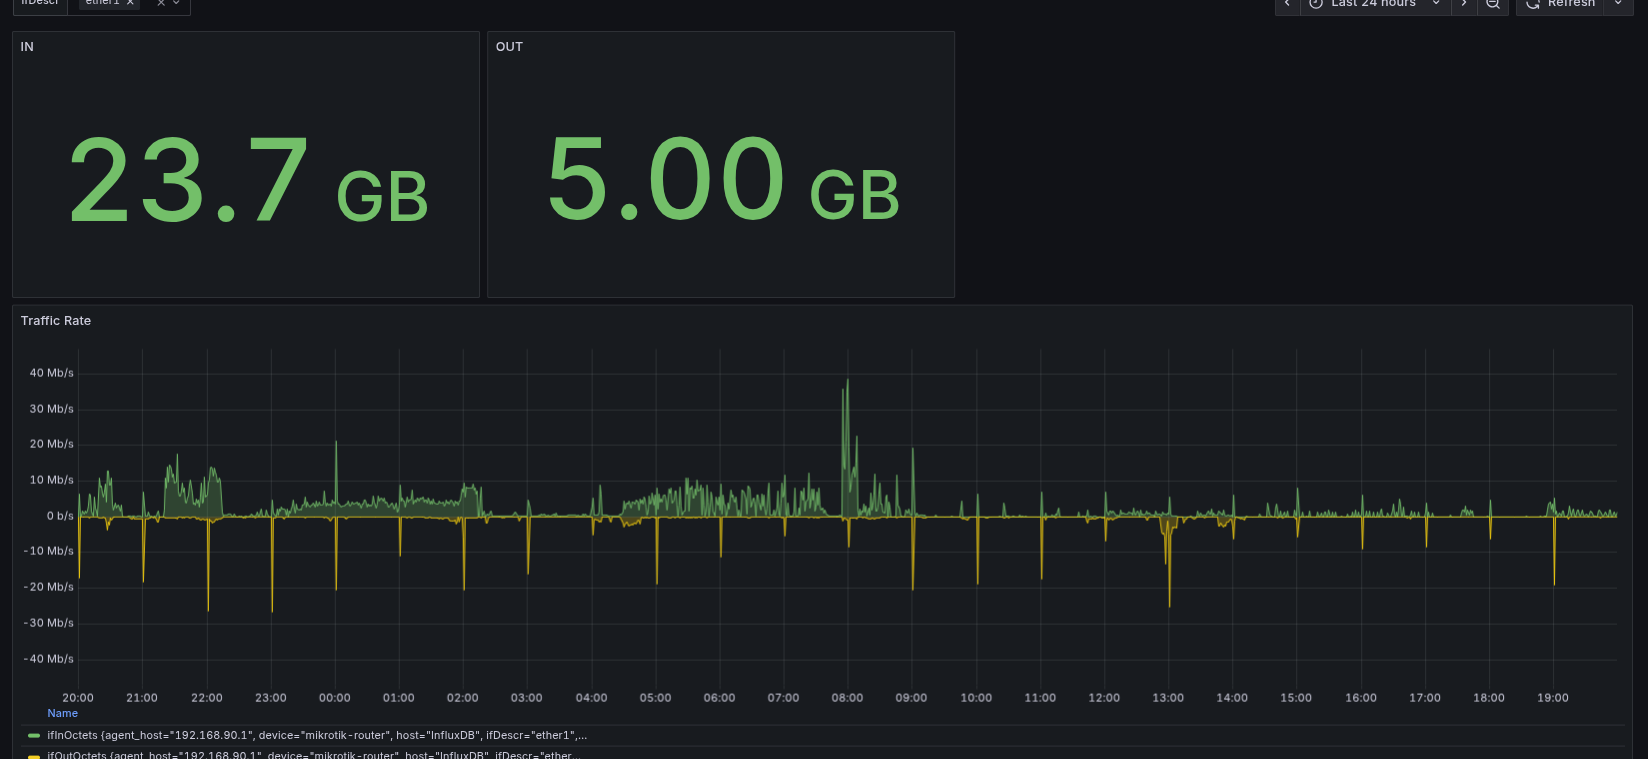
That gives me Mbps in/out over time. I also built stat panels showing total GB transferred in a selected time range.
Tracking Power Usage
The last piece I added to my observability stack wasn’t about CPU or network traffic — it was about power. My homelab runs 24/7, and I was curious (and a little nervous) about how much energy it was actually consuming.
I bought a cheap Wi-Fi smart plug from AliExpress, mostly out of curiosity. When it arrived, I discovered it was Tuya-compatible, which usually means you’re locked into their mobile app and cloud platform. That didn’t sit right with me — I wanted the data in my own stack, not living on someone else’s servers.
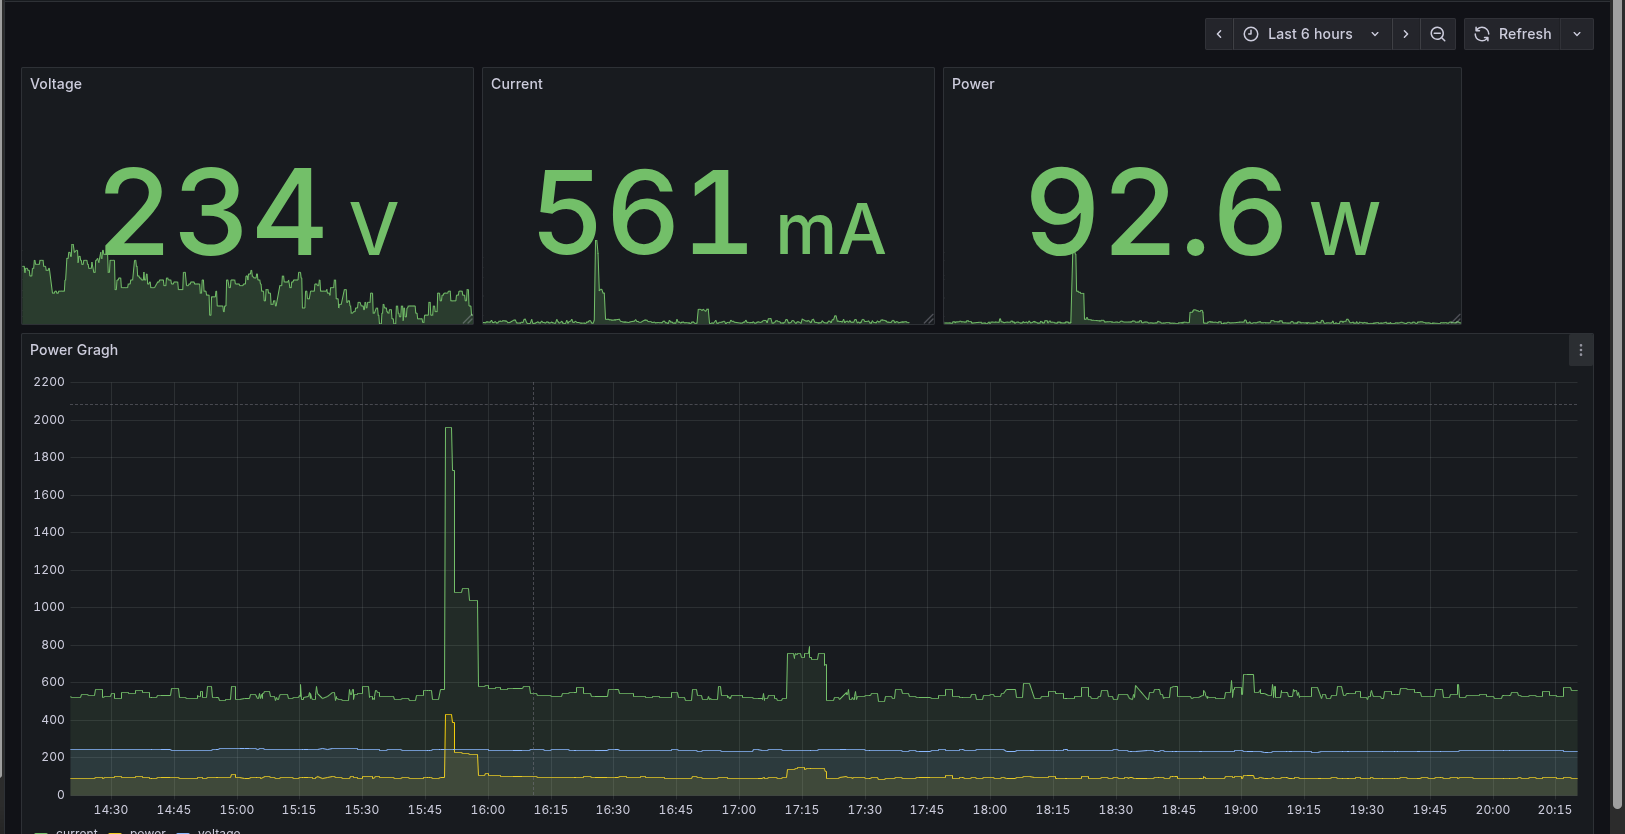
After some tinkering, I figured out a way to pull readings directly from the plug without touching Tuya’s cloud. It spits out metrics such as current draw, voltage, and wattage, which I then forward into InfluxDB for storage. From there, Grafana takes care of visualization.
I also set up alerting rules. If the plug stops reporting, I get a notification (again via Gotify).
This has turned out to be more useful than I expected. I can spot power spikes when workloads ramp up, or notice when something is misbehaving. Over time, it’s given me a much better sense of the baseline power draw of my setup and when I should be concerned.
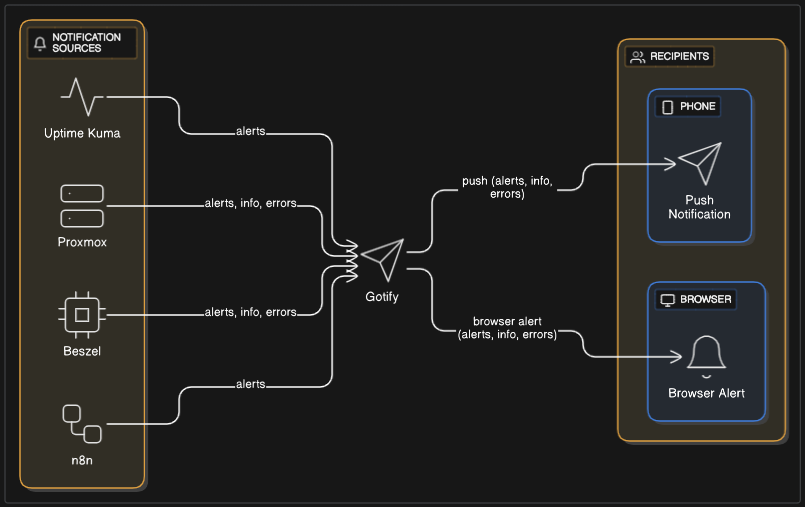
Centralizing Notifications with Gotify
Metrics and dashboards are great, but they’re only useful if I actually know when something goes wrong. That’s where Gotify comes in.
Gotify is a lightweight, self-hosted notification server. Think of it as my personal push service — any tool in my stack that supports Gotify or webhooks can send alerts to it, which Gotify then delivers to my phone or browser.
Reflections
If I’ve learned anything from this part of the journey, it’s that monitoring doesn’t have to be enterprise-level to be useful. Proxmox graphs gave me a taste, but tools like Beszel, Uptime Kuma, and a bit of Grafana turned my homelab from a black box into something I can actually understand and trust.
At the end of the day, my setup is a mix:
- Beszel for system metrics
- Uptime Kuma for service uptime
- Grafana for network + power dashboards
- Gotify for notifications
It’s not perfect, but it’s good enough for me — and that’s kind of the whole point of a homelab.